Before 1-to-1 journeys, get the next five pages right
Every few months, a deck lands on someone’s desk promising 1-to-1 personalized journeys. Each visitor gets their own path, orchestrated in real time. It sounds like where the industry is heading, and for most organisations it is a budget sink: identity resolution, a decisioning layer, content variants for every branch, and a team to maintain all of it. And don’t get me started with privacy. Most of that work starts before anyone has answered a much simpler question.
Given a landing page, which five pages are visitors most likely to open next?
That question is small enough to answer exhaustively, stable enough to act on, and useful immediately: for navigation, for internal linking, for content priorities, for anything that benefits from knowing what comes next.
Work on manageable chunks, not the whole journey
Journey tooling tends to show everything: every step, every branch, every exit. It gives a feeling that the journey is being understood. It is less good at telling you what to do on Monday.
A ranked list of next pages per entry page is less impressive and more actionable. It is also something you can compute, store, and compare from one month to the next.
The data is stored backwards
Analytics tools don’t record a “next page”. They record each page view along with where the visitor came from: the previous page. To know what follows page A, you look at every page view whose previous page is A, and count. Next page is the previous-page relation read in the other direction.
In GA4, that field is the page referrer, which took over from Universal Analytics’ Previous Page Path. It is empty on direct visits and after a session timeout, which is worth knowing before drawing conclusions. Piano Analytics has an equivalent previous page property. Different vendors, same inversion.
Rows, not screenshots
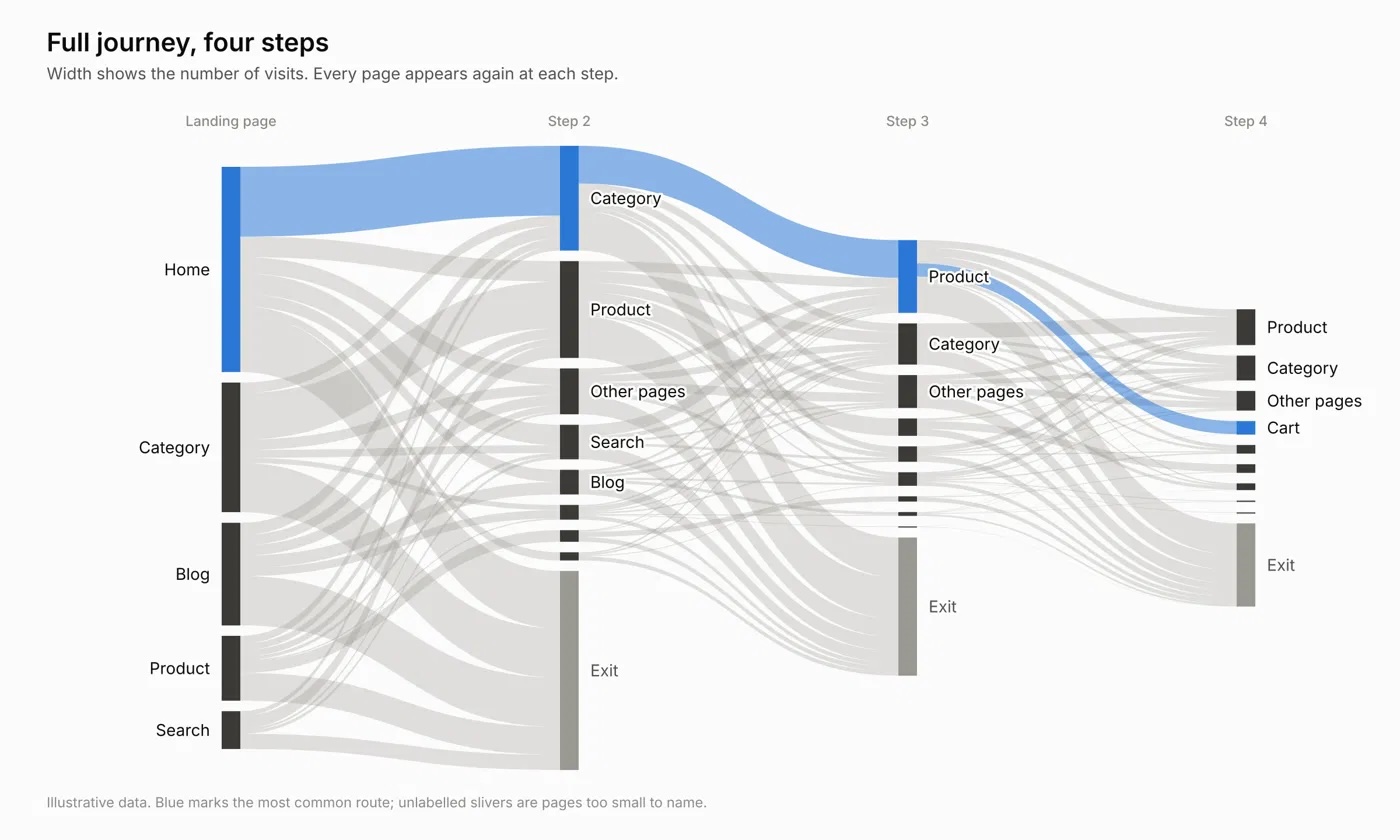
The Sankey diagram is the natural way to look at this data, and it earns its place. Anyone can read it in a meeting. Width shows volume, so dominant paths and big drop-offs are visible at a glance. It starts conversations that a table doesn’t.
Full journey, four steps. The most common route is easy to spot; everything else is not.
In this context, it also has limits. It is built for exploration, not for answering a precise question. Past a few steps and a few dozen pages, it either becomes unreadable or the tool groups the tail into an “other” bucket. Because it is laid out by step, the same page shows up at several levels, and the picture says little about what to do for one given page. And it is a snapshot: hard to export, hard to compare month over month, hard to feed into anything else.
Its cousin, the spaghetti diagram, draws every transition between every page at once. It has the same problem without even the left-to-right order. It is a fair poster of how tangled a site is, and a poor tool for answering a question.
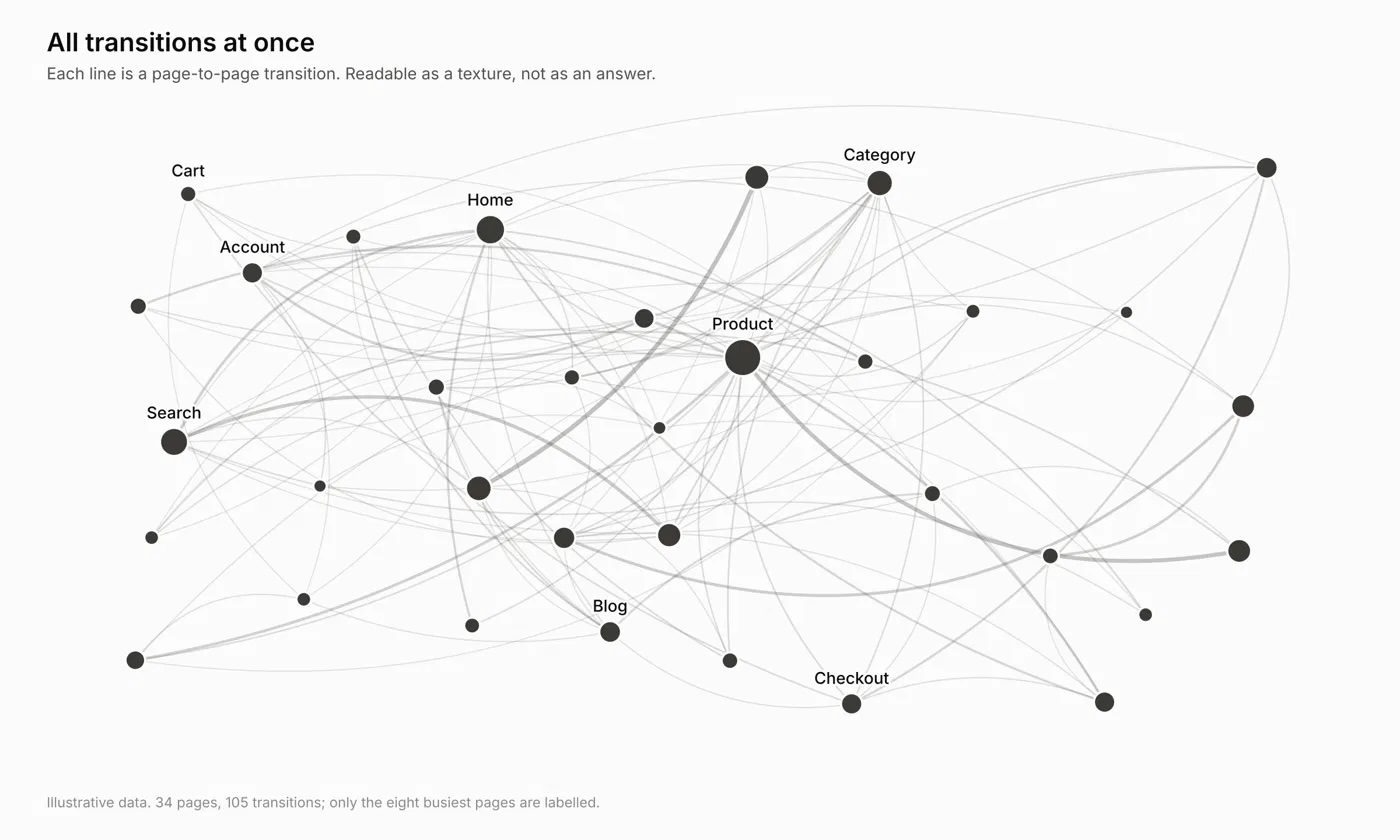
All transitions at once. Readable as a texture, not as an answer.
Neither diagram answers the question on its own. A table does: one row per landing page and next page, ranked by volume. Pair it with a Sankey and you get both the answer and the picture of it. A Sankey scoped to one landing page and its five most likely next pages is readable, honest, and easy to explain.
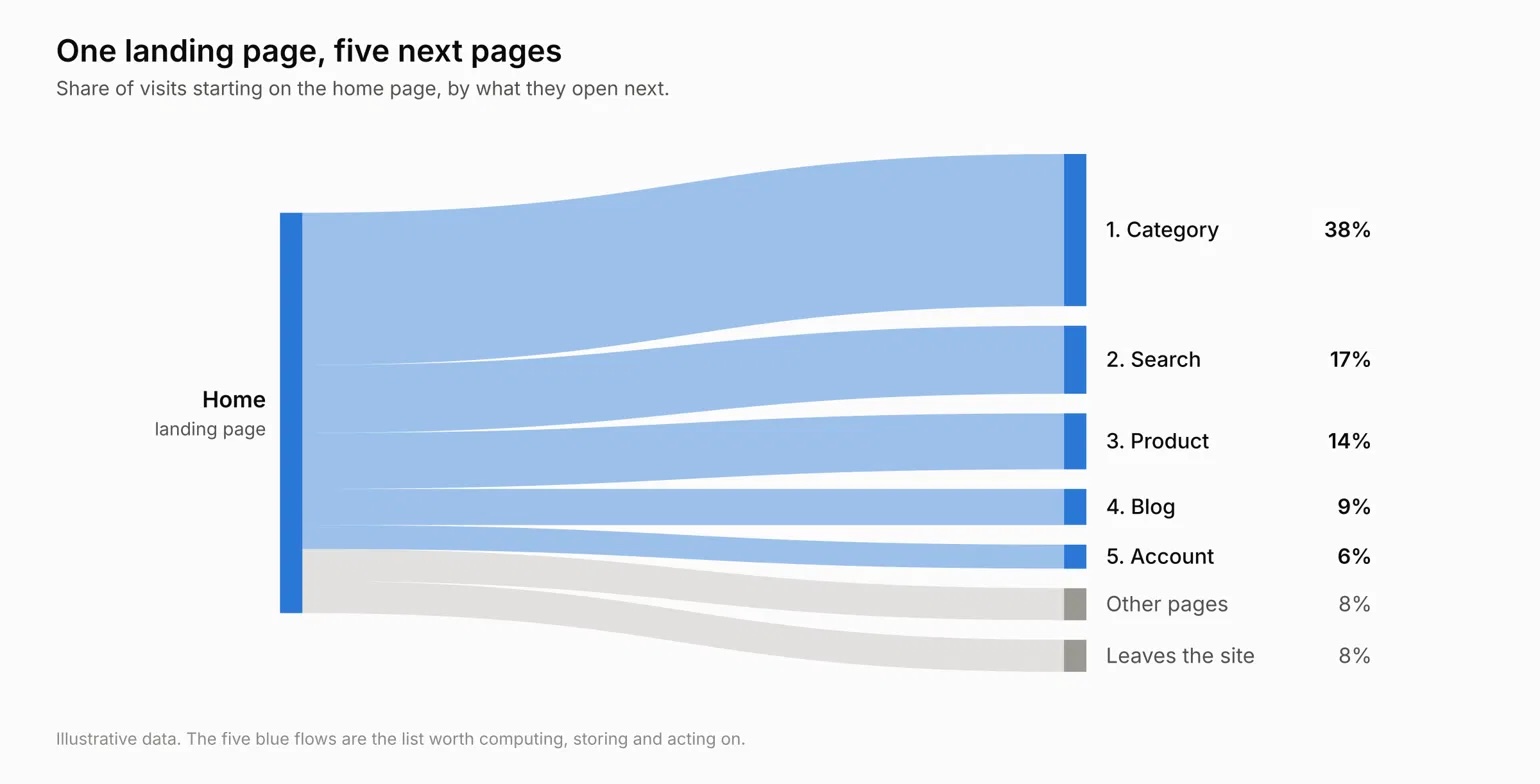
One landing page, its five most likely next pages.
Both Google and Piano Analytics expose this data through their APIs as structured rows: previous page, page, count. That is the useful part. Once the journey is a table of pairs, the top five next pages for any landing page is a sort and a limit. Run it on a schedule, join it with page types, and the same table can feed a navigation module, an internal linking review, or a predictive model. When you need actual sequences rather than pairs, the raw exports (Data Sharing for Piano Analytics, BigQuery for Google Analytics,) are the next step.
Establish pairs first, though. They go a long way.
What makes it work
The model is rarely the hard part. The data underneath is: consistent page naming, normalised URLs, a previous-page value you can trust, session boundaries that mean something, reliable timestamps. This is also why Foresight, which predicts and preloads the next page from Piano or GA data, performs best when it is fed training data that is structured and sequencable.
Start with the five pages. The personalized journey can wait until you know them.
I am also available on-demand as a speaker for data events, contact me to discuss details!