Hey kids,
this post is just a quick tip to better visualize your Google Analytics data in terms of performance.
Sure, there are lots of ways to visually compare and analyze data directly in Google Analytics – or any other digital analytics solution for that matter. But bear with me and I’ll show you a neat trick… in Excel 😉
Got your GA open? Good! In this post, we will use something basic: figure out which days of the week bring the most conversions. Because that report is not avalable by default in Google Analytics, we’ll have to make our own custom report. Let’s start by creating a custom report, using a flat data table. I only need 2 dimensions for this so lets choose Day of the Week and Date.
As far as metrics go, have fun and add a bunch but ideally you’ll want to show performance so let’s go with conversion rate for one of my goals – or in this example the overall conversion rate, which we all know better than to use because it can add up to 2000% in a perfect situation, but i digress.
Here is what your report building interface should look like:

If confused or lost, just click this link and you will get a copy of the custom report for your profile(s). You’re welcome.
Anyhow, you should be getting output similar to the following:
 Great. Notice that I’m using the usual 30-day rolling calendar period. This means I’ll need to extend my report rows to include all possible date/day of the week combos for the period. Hint: for a 30-day period, you need 30 rows so go ahead and select 50 rows instead of the default 10 lines. Done?
Ok so you have a bunch of entries with days listed as numbers? Don’t panic, 0 is Sunday, 1 is Monday [yadda yadda], and 6 is Saturday. The other column is just days listed in YYYYMMDD format.
Fine. Now what the heck can I do with that? Well, in a regular Google Analytics report, you *could* show the “vs site average” visualization with horizontal comparison markers. Unfortunately, we’re in a custom report here so we’ll have to use our imagination and, ironically enough, Excel. If you can afford it, you could probably achieve the same result with Tableau Software, QlikView or BIME but that’s a topic for another post.
Now let’s export this baby to a format Excel can understand and GA now supports .xlsx exports for Excel 2007 and higher – wunderbar! So let’s do this, chop chop. And don’t forget to extract enough lines!
Open your extract in Excel and navigate to the “Dataset1″ tab: your data is there, yay! Now let’s convert those day numbers into day labels. Use a find/replace operation or use a macro. You can re-use the one below:
[code]Sub replaceDaysOfWeek()
‘
‘ replaceDaysOfWeek Macro
‘ Replace day identifiers (0-6) with day labels (Sun-Sat)
‘
Cells.Replace What:=”0″, Replacement:=”Sun”, LookAt:=xlWhole, _
SearchOrder:=xlByColumns, MatchCase:=False
Cells.Replace What:=”1″, Replacement:=”Mon”, LookAt:=xlWhole, _
SearchOrder:=xlByColumns, MatchCase:=False
Cells.Replace What:=”2″, Replacement:=”Tue”, LookAt:=xlWhole, _
SearchOrder:=xlByColumns, MatchCase:=False
Cells.Replace What:=”3″, Replacement:=”Wed”, LookAt:=xlWhole, _
SearchOrder:=xlByColumns, MatchCase:=False
Cells.Replace What:=”4″, Replacement:=”Thu”, LookAt:=xlWhole, _
SearchOrder:=xlByColumns, MatchCase:=False
Cells.Replace What:=”5″, Replacement:=”Fri”, LookAt:=xlWhole, _
SearchOrder:=xlByColumns, MatchCase:=False
Cells.Replace What:=”6″, Replacement:=”Sat”, LookAt:=xlWhole, _
SearchOrder:=xlByColumns, MatchCase:=False
End Sub
[/code]
Next time you’ll only need to run the macro instead of doing a search/replace operation 7 times in a row.
Now let’s get into this data and use a pivot table (pivot table creation interface differs on a PC but you’ll get the gist of it). Select all your data and create a pivot table from it. If up until today you have used Excel without using pivot tables, I can’t help you 😉
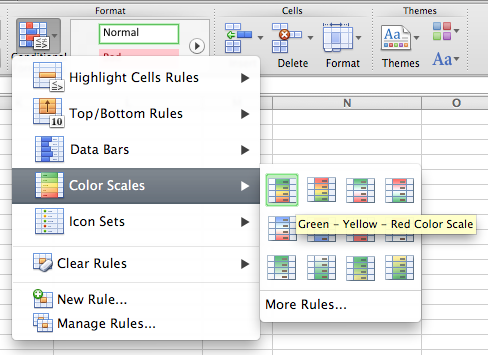
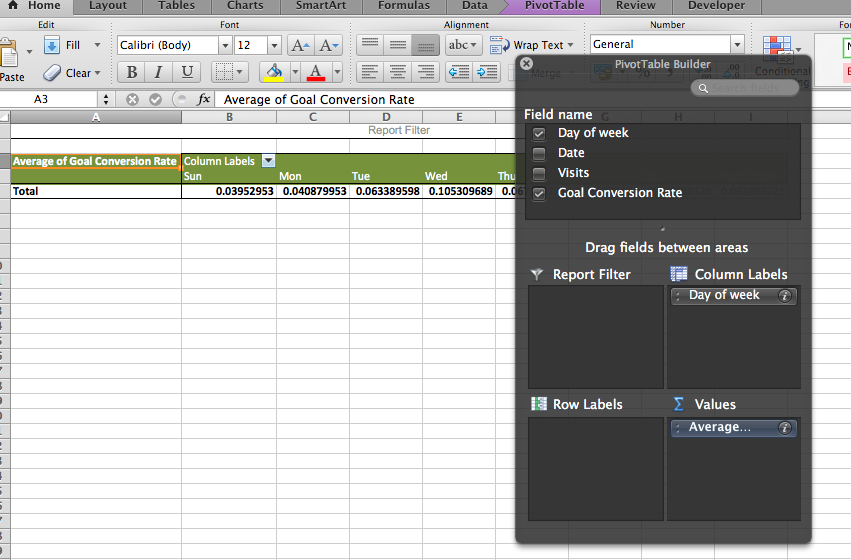 Notice how we used Day of Week as a column and the conversion rate as a metric (value) but set it to Average instead of sum. Now let’s add some formatting and make those field percentages with a couple decimals digits. If you can, hide the Grand Total column. Now select your “daily” values, use conditional formatting and select a color scale:
 The result? A clear, color-coded “heatmap” representation of performance per day as shown below:

Now go back to the pivot table builder and add dates as rows and BAM!
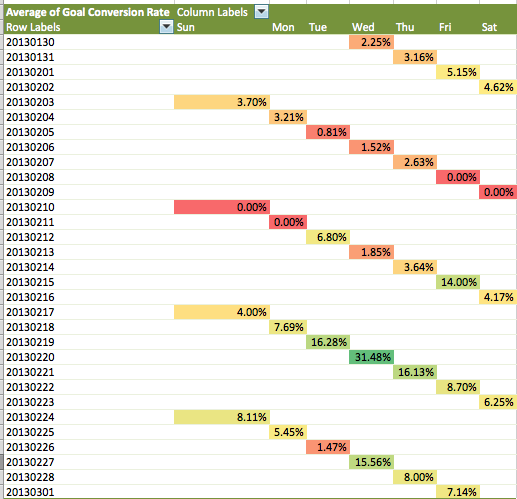 I get my conversion rate by day of the week in a very clear, visual manner. And I can use this method for quite a few extracts!
Let’s extend this example to hours of the day per day of the week, which is not viewable in Google Analytics except on a day-by-day basis:
 Again, use a flat table and select Hour and Day of week as dimensions and use visits and overall conversion rate as metrics – or use your own metrics. Expect a maximum of 168 (24 x 7) rows so when you open your Google Analytics report, mosey over to the entry limit drop down menu and select 250.
PRO TIP: you can also fiddle with report URL parameters to get the number of rows you need 😉
Happy with your report? Export to Excel again! Replace day numbers with labels using the macro from earlier but as a precaution, cut value from column A, run the macro then paste data back.
Select all data, create a new pivot table and use Day of week as columns and Hour of the day as rows, the use average of conversion rate as value. Apply percentage formatting, add decimals and use conditional formatting.
And now before your very eyes ladies and gentlemen: how your site performs in terms of conversion, day by day, hour by hour.
 You are more than welcome 😉
In another post (or in comments), we can discuss using the API and/or third-party plug-ins such as Tatvic or Excellent Analytics to refresh the data table and update the pivot table.
I know it’s kind of sad we had to resort to using Excel to pull this sort of data but here’s hoping that Google will eventually work this into a later version of Google Analytics!
Like this? Say so in the comments and/or contact me for more information.
Leave a Reply